Talsperrensteuerzentrale
Stauanlage TS Neunzehnhain 2
Letzte Aktualisierung der Webseite: 02.05.2024 21:00 Uhr (MESZ)
Allgemeine Angaben:
Gewässer: Lautenbach
Flusseinzugsgebiet: Freiberger Mulde / Zschopau
Einzugsgebietsgröße: 13,463 km²
Naturraum: Mittleres Erzgebirge
Nächstgelegene Stadt: Lengefeld
Zuflusspegel Neunzehnhain 2/ Lautenbach
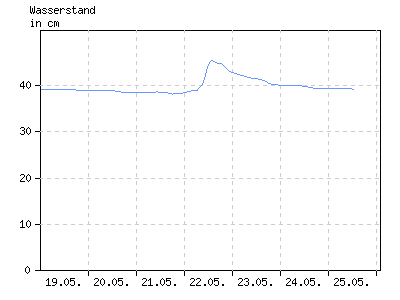
Wasserstand in cm
| 01:00 | 04:00 | 07:00 | 10:00 | 13:00 | 16:00 | 19:00 | 22:00 | |
|---|---|---|---|---|---|---|---|---|
| 26.04. | 42 | 42 | 42 | 42 | 42 | 42 | 42 | 42 |
| 27.04. | 42 | 42 | 42 | 41 | 41 | 41 | 41 | 41 |
| 28.04. | 41 | 41 | 41 | 41 | 41 | 40 | 40 | 40 |
| 29.04. | 40 | 40 | 40 | 40 | 40 | 40 | 40 | 40 |
| 30.04. | 40 | 40 | 40 | 40 | 40 | 40 | 40 | 40 |
| 01.05. | 40 | 40 | 40 | 40 | 40 | 40 | 40 | 40 |
| 02.05. | 40 | 40 | k.A. | 40 | 40 | 40 | 39 | k.A. |
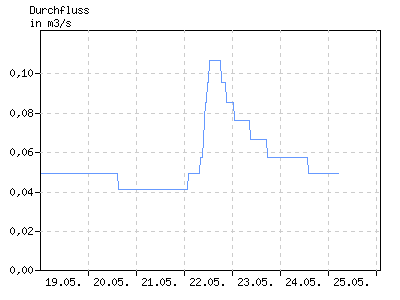
Durchfluss in m³/s
| 01:00 | 04:00 | 07:00 | 10:00 | 13:00 | 16:00 | 19:00 | 22:00 | |
|---|---|---|---|---|---|---|---|---|
| 26.04. | 0,076 | 0,076 | 0,076 | 0,076 | 0,076 | 0,076 | 0,076 | 0,076 |
| 27.04. | 0,076 | 0,076 | 0,076 | 0,066 | 0,066 | 0,066 | 0,066 | 0,066 |
| 28.04. | 0,066 | 0,066 | 0,066 | 0,066 | 0,066 | 0,066 | 0,057 | 0,057 |
| 29.04. | 0,057 | 0,057 | 0,057 | 0,066 | 0,057 | 0,057 | 0,057 | 0,057 |
| 30.04. | 0,057 | 0,057 | 0,057 | 0,057 | 0,057 | 0,057 | 0,057 | 0,057 |
| 01.05. | 0,057 | 0,057 | 0,057 | 0,057 | 0,057 | 0,057 | 0,057 | 0,057 |
| 02.05. | 0,057 | 0,057 | k.A. | 0,057 | 0,057 | 0,057 | 0,049 | k.A. |
Abgabepegel
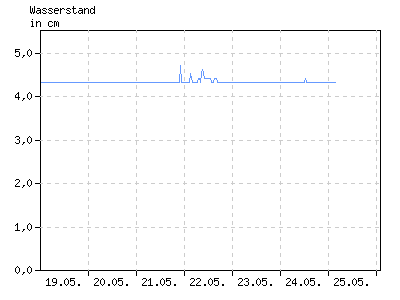
Wasserstand in cm
| 01:00 | 04:00 | 07:00 | 10:00 | 13:00 | 16:00 | 19:00 | 22:00 | |
|---|---|---|---|---|---|---|---|---|
| 26.04. | 4 | 4 | 4 | 4 | 4 | 4 | 4 | 4 |
| 27.04. | 4 | 4 | 4 | 4 | 4 | 4 | 4 | 4 |
| 28.04. | 4 | 4 | 4 | 4 | 4 | 4 | 4 | 4 |
| 29.04. | 4 | 4 | 4 | 4 | 4 | 4 | 4 | 4 |
| 30.04. | 4 | 4 | 4 | 4 | 4 | 4 | 4 | 4 |
| 01.05. | 4 | 4 | 4 | 3 | 4 | 4 | 4 | 4 |
| 02.05. | 4 | 4 | 4 | 4 | 4 | 4 | 4 | k.A. |
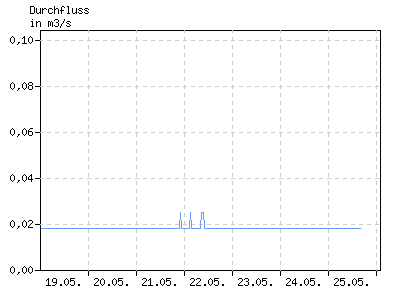
Durchfluss in m³/s
| 01:00 | 04:00 | 07:00 | 10:00 | 13:00 | 16:00 | 19:00 | 22:00 | |
|---|---|---|---|---|---|---|---|---|
| 26.04. | 0,018 | 0,018 | 0,018 | 0,018 | 0,018 | 0,018 | 0,018 | 0,018 |
| 27.04. | 0,018 | 0,018 | 0,018 | 0,018 | 0,018 | 0,018 | 0,018 | 0,018 |
| 28.04. | 0,018 | 0,018 | 0,018 | 0,018 | 0,018 | 0,018 | 0,018 | 0,018 |
| 29.04. | 0,018 | 0,018 | 0,018 | 0,018 | 0,018 | 0,018 | 0,018 | 0,018 |
| 30.04. | 0,018 | 0,018 | 0,018 | 0,018 | 0,018 | 0,018 | 0,018 | 0,018 |
| 01.05. | 0,018 | 0,018 | 0,018 | 0,012 | 0,018 | 0,018 | 0,018 | 0,018 |
| 02.05. | 0,018 | 0,018 | 0,018 | 0,018 | 0,018 | 0,018 | 0,018 | k.A. |
Stauanlage
| Teilstauraum | Staulamelle einzeln [Mio. m³] |
Stauinhalt summarisch [Mio. m³] |
|---|---|---|
| Totraum | 0,000 | 0,000 |
| Reserveraum | 0,300 | 0,300 |
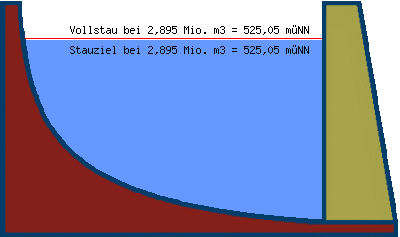
| Betriebsraum | 2,595 | 2,895 |
| gewöhnlicher Hochwasser- rückhalteraum |
0,000 | 2,895 |
Beckeninhalt in Mio m³
| 01:00 | 04:00 | 07:00 | 10:00 | 13:00 | 16:00 | 19:00 | 22:00 | |
|---|---|---|---|---|---|---|---|---|
| 26.04. | 2,826 | 2,826 | 2,826 | 2,823 | 2,823 | 2,823 | 2,823 | 2,823 |
| 27.04. | 2,823 | 2,818 | 2,818 | 2,818 | 2,818 | 2,818 | 2,818 | 2,818 |
| 28.04. | 2,818 | 2,818 | 2,818 | 2,818 | 2,818 | 2,818 | 2,818 | 2,818 |
| 29.04. | 2,818 | 2,818 | 2,818 | 2,818 | 2,818 | 2,818 | 2,818 | 2,818 |
| 30.04. | 2,818 | 2,818 | 2,818 | 2,818 | 2,823 | 2,823 | 2,823 | 2,823 |
| 01.05. | 2,823 | 2,823 | 2,823 | 2,823 | 2,824 | 2,824 | 2,823 | 2,823 |
| 02.05. | 2,824 | 2,823 | 2,824 | 2,825 | 2,824 | 2,824 | 2,826 | k.A. |
Wasserstand in müNN
| 01:00 | 04:00 | 07:00 | 10:00 | 13:00 | 16:00 | 19:00 | 22:00 | |
|---|---|---|---|---|---|---|---|---|
| 26.04. | 524,81 | 524,81 | 524,81 | 524,80 | 524,80 | 524,80 | 524,80 | 524,80 |
| 27.04. | 524,80 | 524,79 | 524,79 | 524,79 | 524,78 | 524,78 | 524,78 | 524,78 |
| 28.04. | 524,78 | 524,78 | 524,78 | 524,78 | 524,78 | 524,78 | 524,78 | 524,78 |
| 29.04. | 524,78 | 524,78 | 524,78 | 524,78 | 524,79 | 524,79 | 524,79 | 524,79 |
| 30.04. | 524,79 | 524,79 | 524,79 | 524,79 | 524,80 | 524,80 | 524,80 | 524,80 |
| 01.05. | 524,80 | 524,80 | 524,80 | 524,80 | 524,80 | 524,80 | 524,80 | 524,80 |
| 02.05. | 524,80 | 524,80 | k.A. | 524,80 | 524,80 | 524,81 | 524,81 | k.A. |