Talsperrensteuerzentrale
Stauanlage TS Radeburg II
Letzte Aktualisierung der Webseite: 15.05.2025 15:00 Uhr (MESZ)
Allgemeine Angaben:
Gewässer: Dobrabach
Flusseinzugsgebiet: Oberes Elbtal
Einzugsgebietsgröße: 332,042 km²
Naturraum: Sächsisches Hügelland
Nächstgelegene Stadt: Großenhain
Zuflusspegel Überleiterkanal SP1 zu SP2
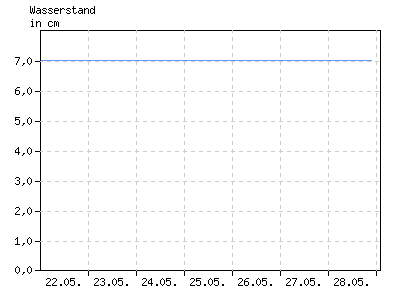
Wasserstand in cm
| 01:00 | 04:00 | 07:00 | 10:00 | 13:00 | 16:00 | 19:00 | 22:00 | |
|---|---|---|---|---|---|---|---|---|
| 09.05. | 9 | 9 | 9 | 9 | 9 | 9 | 9 | 9 |
| 10.05. | 9 | 9 | 9 | 9 | 9 | 9 | 9 | 9 |
| 11.05. | 9 | 9 | 9 | 9 | 9 | 9 | 9 | 9 |
| 12.05. | 9 | 9 | 9 | 9 | 9 | 9 | 9 | 9 |
| 13.05. | 9 | 9 | 9 | 9 | 9 | 9 | 9 | 9 |
| 14.05. | 9 | 9 | 9 | 9 | 9 | 9 | 9 | 9 |
| 15.05. | 9 | 9 | 9 | 9 | 9 | k.A. | k.A. | k.A. |
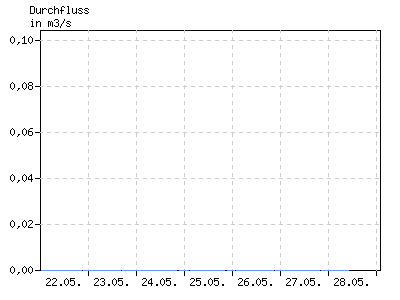
Durchfluss in m³/s
| 01:00 | 04:00 | 07:00 | 10:00 | 13:00 | 16:00 | 19:00 | 22:00 | |
|---|---|---|---|---|---|---|---|---|
| 09.05. | 0,000 | 0,000 | 0,000 | 0,000 | 0,000 | 0,000 | 0,000 | 0,000 |
| 10.05. | 0,000 | 0,000 | 0,000 | 0,000 | 0,000 | 0,000 | 0,000 | 0,000 |
| 11.05. | 0,000 | 0,000 | 0,000 | 0,000 | 0,000 | 0,000 | 0,000 | 0,000 |
| 12.05. | 0,000 | 0,000 | 0,000 | 0,000 | 0,000 | 0,000 | 0,000 | 0,000 |
| 13.05. | 0,000 | 0,000 | 0,000 | 0,000 | 0,000 | 0,000 | 0,000 | 0,000 |
| 14.05. | 0,000 | 0,000 | 0,000 | 0,000 | 0,000 | 0,000 | 0,000 | 0,000 |
| 15.05. | 0,000 | 0,000 | 0,000 | 0,000 | 0,000 | k.A. | k.A. | k.A. |
Abgabepegel
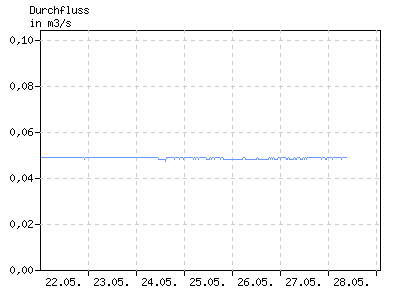
Durchfluss in m³/s
| 01:00 | 04:00 | 07:00 | 10:00 | 13:00 | 16:00 | 19:00 | 22:00 | |
|---|---|---|---|---|---|---|---|---|
| 09.05. | 0,049 | 0,048 | 0,048 | 0,048 | 0,048 | 0,049 | 0,048 | 0,049 |
| 10.05. | 0,049 | 0,049 | 0,048 | 0,049 | 0,048 | 0,048 | 0,048 | 0,048 |
| 11.05. | 0,048 | 0,048 | 0,049 | 0,048 | 0,048 | 0,049 | 0,049 | 0,048 |
| 12.05. | 0,048 | 0,048 | 0,049 | 0,048 | 0,048 | 0,048 | 0,048 | 0,049 |
| 13.05. | 0,048 | 0,049 | 0,048 | 0,049 | 0,049 | 0,049 | 0,049 | 0,048 |
| 14.05. | 0,048 | 0,048 | 0,048 | 0,048 | 0,048 | 0,049 | 0,049 | 0,048 |
| 15.05. | 0,048 | 0,049 | 0,049 | 0,048 | 0,049 | k.A. | k.A. | k.A. |
Stauanlage
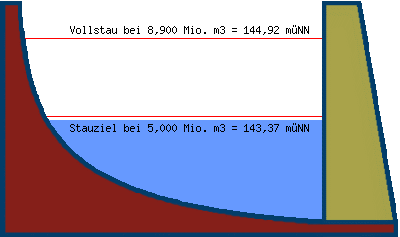
| Teilstauraum | Staulamelle einzeln [Mio. m³] |
Stauinhalt summarisch [Mio. m³] |
|---|---|---|
| Totraum | 0,000 | 0,000 |
| Reserveraum | 3,000 | 3,000 |
| Betriebsraum | 2,000 | 5,000 |
| gewöhnlicher Hochwasser- rückhalteraum |
3,900 | 8,900 |
Beckeninhalt in Mio m³
| 01:00 | 04:00 | 07:00 | 10:00 | 13:00 | 16:00 | 19:00 | 22:00 | |
|---|---|---|---|---|---|---|---|---|
| 09.05. | 4,871 | 4,871 | 4,871 | 4,828 | 4,828 | 4,807 | 4,807 | 4,807 |
| 10.05. | 4,807 | 4,807 | 4,807 | 4,807 | 4,807 | 4,807 | 4,807 | 4,807 |
| 11.05. | 4,807 | 4,807 | 4,807 | 4,764 | 4,764 | 4,764 | 4,764 | 4,764 |
| 12.05. | 4,764 | 4,764 | 4,764 | 4,764 | 4,764 | 4,764 | 4,764 | 4,764 |
| 13.05. | 4,764 | 4,764 | 4,764 | 4,764 | 4,764 | 4,764 | 4,764 | 4,764 |
| 14.05. | 4,764 | 4,764 | 4,764 | 4,742 | 4,742 | 4,742 | 4,742 | 4,742 |
| 15.05. | 4,742 | 4,742 | 4,742 | 4,699 | 4,699 | k.A. | k.A. | k.A. |
Wasserstand in müNN
| 01:00 | 04:00 | 07:00 | 10:00 | 13:00 | 16:00 | 19:00 | 22:00 | |
|---|---|---|---|---|---|---|---|---|
| 09.05. | 143,30 | 143,30 | 143,30 | 143,28 | 143,28 | 143,27 | 143,27 | 143,27 |
| 10.05. | 143,27 | 143,27 | 143,27 | 143,27 | 143,27 | 143,27 | 143,27 | 143,27 |
| 11.05. | 143,27 | 143,27 | 143,27 | 143,26 | 143,26 | 143,26 | 143,26 | 143,26 |
| 12.05. | 143,26 | 143,26 | 143,26 | 143,25 | 143,25 | 143,25 | 143,25 | 143,25 |
| 13.05. | 143,25 | 143,25 | 143,25 | 143,25 | 143,25 | 143,25 | 143,25 | 143,25 |
| 14.05. | 143,25 | 143,25 | 143,25 | 143,24 | 143,24 | 143,24 | 143,24 | 143,24 |
| 15.05. | 143,24 | 143,24 | 143,24 | 143,23 | 143,23 | k.A. | k.A. | k.A. |