Talsperrensteuerzentrale
Stauanlage TS Wolfersgrün
Letzte Aktualisierung der Webseite: 02.05.2024 04:30 Uhr (MESZ)
Allgemeine Angaben:
Gewässer:
Flusseinzugsgebiet: Zwickauer Mulde / Obere Weiße Elster
Einzugsgebietsgröße: 47,190 km²
Naturraum:
Nächstgelegene Stadt:
Zuflusspegel Pegel Hirschfelder Wasser
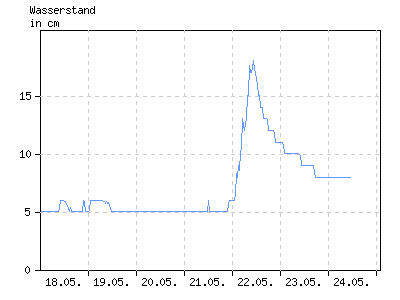
Wasserstand in cm
| 01:00 | 04:00 | 07:00 | 10:00 | 13:00 | 16:00 | 19:00 | 22:00 | |
|---|---|---|---|---|---|---|---|---|
| 26.04. | 8 | 8 | 8 | 8 | 8 | 8 | 8 | 8 |
| 27.04. | 8 | 8 | 8 | 7 | 7 | 7 | 7 | 7 |
| 28.04. | 7 | 7 | 7 | 7 | 7 | 7 | 7 | 7 |
| 29.04. | 7 | 7 | 7 | 7 | 7 | 7 | 7 | 6 |
| 30.04. | 7 | 7 | 7 | 7 | 7 | 6 | 6 | 6 |
| 01.05. | 6 | 6 | 7 | 6 | 6 | 6 | 6 | 6 |
| 02.05. | 6 | 6 | k.A. | k.A. | k.A. | k.A. | k.A. | k.A. |
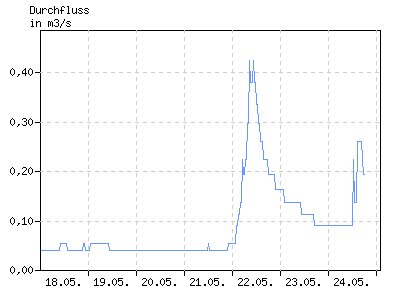
Durchfluss in m³/s
| 01:00 | 04:00 | 07:00 | 10:00 | 13:00 | 16:00 | 19:00 | 22:00 | |
|---|---|---|---|---|---|---|---|---|
| 26.04. | 0,090 | 0,090 | 0,090 | 0,090 | 0,090 | 0,090 | 0,090 | 0,090 |
| 27.04. | 0,090 | 0,090 | 0,090 | 0,071 | 0,071 | 0,071 | 0,071 | 0,071 |
| 28.04. | 0,071 | 0,071 | 0,071 | 0,071 | 0,071 | 0,071 | 0,071 | 0,071 |
| 29.04. | 0,071 | 0,071 | 0,071 | 0,071 | 0,071 | 0,071 | 0,071 | 0,054 |
| 30.04. | 0,071 | 0,071 | 0,071 | 0,071 | 0,071 | 0,054 | 0,054 | 0,054 |
| 01.05. | 0,054 | 0,054 | 0,071 | 0,054 | 0,054 | 0,054 | 0,054 | 0,054 |
| 02.05. | 0,054 | k.A. | k.A. | k.A. | k.A. | k.A. | k.A. | k.A. |
Abgabepegel
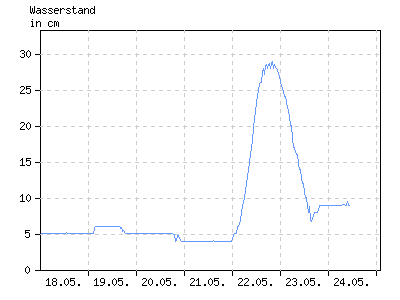
Wasserstand in cm
| 01:00 | 04:00 | 07:00 | 10:00 | 13:00 | 16:00 | 19:00 | 22:00 | |
|---|---|---|---|---|---|---|---|---|
| 26.04. | 10 | 10 | 10 | 10 | 9 | 9 | 9 | 9 |
| 27.04. | 9 | 9 | 9 | 9 | 9 | 8 | 8 | 8 |
| 28.04. | 8 | 8 | 8 | 8 | 7 | 7 | 7 | 7 |
| 29.04. | 7 | 7 | 7 | 7 | 7 | 7 | 7 | 7 |
| 30.04. | 7 | 7 | 7 | 7 | 7 | 7 | 7 | 7 |
| 01.05. | 6 | 6 | 6 | 6 | 6 | 7 | 6 | 6 |
| 02.05. | 6 | 6 | k.A. | k.A. | k.A. | k.A. | k.A. | k.A. |
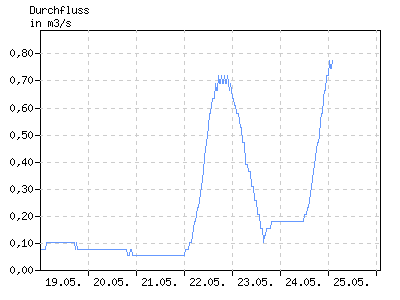
Durchfluss in m³/s
| 01:00 | 04:00 | 07:00 | 10:00 | 13:00 | 16:00 | 19:00 | 22:00 | |
|---|---|---|---|---|---|---|---|---|
| 26.04. | 0,204 | 0,204 | 0,204 | 0,204 | 0,178 | 0,178 | 0,178 | 0,178 |
| 27.04. | 0,178 | 0,178 | 0,178 | 0,178 | 0,178 | 0,152 | 0,152 | 0,152 |
| 28.04. | 0,152 | 0,152 | 0,152 | 0,152 | 0,127 | 0,127 | 0,127 | 0,127 |
| 29.04. | 0,127 | 0,127 | 0,127 | 0,127 | 0,127 | 0,127 | 0,127 | 0,127 |
| 30.04. | 0,127 | 0,127 | 0,127 | 0,127 | 0,127 | 0,127 | 0,127 | 0,127 |
| 01.05. | 0,102 | 0,102 | 0,102 | 0,102 | 0,102 | 0,127 | 0,102 | 0,102 |
| 02.05. | 0,102 | k.A. | k.A. | k.A. | k.A. | k.A. | k.A. | k.A. |
Stauanlage
| Teilstauraum | Staulamelle einzeln [Mio. m³] |
Stauinhalt summarisch [Mio. m³] |
|---|---|---|
| Totraum | 0,000 | 0,000 |
| Reserveraum | k.A. | k.A. |
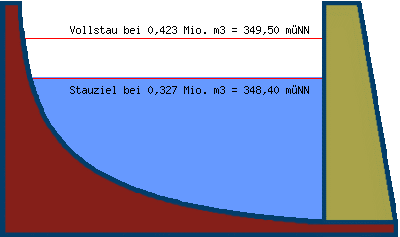
| Betriebsraum | 0,264 | 0,327 |
| gewöhnlicher Hochwasser- rückhalteraum |
0,096 | 0,423 |
Beckeninhalt in Mio m³
| 01:00 | 04:00 | 07:00 | 10:00 | 13:00 | 16:00 | 19:00 | 22:00 | |
|---|---|---|---|---|---|---|---|---|
| 26.04. | 0,335 | 0,335 | 0,335 | 0,335 | 0,335 | 0,335 | 0,335 | 0,335 |
| 27.04. | 0,335 | 0,335 | 0,334 | 0,334 | 0,334 | 0,334 | 0,334 | 0,334 |
| 28.04. | 0,334 | 0,334 | 0,334 | 0,334 | 0,334 | 0,333 | 0,334 | 0,334 |
| 29.04. | 0,333 | 0,334 | 0,334 | 0,334 | 0,334 | 0,334 | 0,334 | 0,333 |
| 30.04. | 0,333 | 0,333 | 0,333 | 0,333 | 0,333 | 0,333 | 0,333 | 0,333 |
| 01.05. | 0,333 | 0,333 | 0,333 | 0,333 | 0,333 | 0,333 | 0,333 | 0,333 |
| 02.05. | 0,333 | 0,333 | k.A. | k.A. | k.A. | k.A. | k.A. | k.A. |
Wasserstand in müNN
| 01:00 | 04:00 | 07:00 | 10:00 | 13:00 | 16:00 | 19:00 | 22:00 | |
|---|---|---|---|---|---|---|---|---|
| 26.04. | 348,50 | 348,50 | 348,50 | 348,50 | 348,49 | 348,49 | 348,49 | 348,49 |
| 27.04. | 348,49 | 348,49 | 348,49 | 348,49 | 348,49 | 348,49 | 348,49 | 348,49 |
| 28.04. | 348,48 | 348,48 | 348,48 | 348,48 | 348,48 | 348,48 | 348,48 | 348,48 |
| 29.04. | 348,48 | 348,48 | 348,48 | 348,48 | 348,48 | 348,48 | 348,48 | 348,48 |
| 30.04. | 348,48 | 348,48 | 348,48 | 348,47 | 348,47 | 348,47 | 348,47 | 348,47 |
| 01.05. | 348,47 | 348,47 | 348,47 | 348,47 | 348,47 | 348,47 | 348,47 | 348,47 |
| 02.05. | 348,47 | 348,47 | k.A. | k.A. | k.A. | k.A. | k.A. | k.A. |